 Web Server Statistics for chatroom.kcu.ac.ug
Program started on Thu, Mar 30 2023 at 3:03 PM.
Analyzed requests from Wed, Mar 22 2023 at 5:26 AM to Wed, Mar 29 2023 at 4:52 PM (7.48 days).
Web Server Statistics for chatroom.kcu.ac.ugProgram started on Thu, Mar 30 2023 at 3:03 PM.
Analyzed requests from Wed, Mar 22 2023 at 5:26 AM to Wed, Mar 29 2023 at 4:52 PM (7.48 days).
(Go To: Top | General Summary | Monthly Report | Daily Summary | Hourly Summary | Domain Report | Organization Report | Browser Report | Browser Summary | Operating System Report | Status Code Report | File Size Report | File Type Report | Directory Report | Request Report)
Figures in parentheses refer to the 7-day period ending Mar 30 2023 at 3:03 PM.
Successful requests: 11 (7)
Average successful requests per day: 1 (0)
Successful requests for pages: 11 (7)
Average successful requests for pages per day: 1 (0)
Failed requests: 10 (1)
Distinct files requested: 3 (4)
Distinct hosts served: 10 (15)
Data transferred: 8.74 kilobytes (5.56 kilobytes)
Average data transferred per day: 1.17 kilobytes (814 bytes)
(Go To: Top | General Summary | Monthly Report | Daily Summary | Hourly Summary | Domain Report | Organization Report | Browser Report | Browser Summary | Operating System Report | Status Code Report | File Size Report | File Type Report | Directory Report | Request Report)
Each unit ( ) represents 1 request for a page.
| month | #reqs | #pages | |
|---|---|---|---|
| Mar 2023 | 11 | 11 |   |
Busiest month: Mar 2023 (11 requests for pages).
(Go To: Top | General Summary | Monthly Report | Daily Summary | Hourly Summary | Domain Report | Organization Report | Browser Report | Browser Summary | Operating System Report | Status Code Report | File Size Report | File Type Report | Directory Report | Request Report)
Each unit () represents 1 request for a page.
| day | #reqs | #pages | |
|---|---|---|---|
| Sun | 2 | 2 | |
| Mon | 0 | 0 | |
| Tue | 0 | 0 | |
| Wed | 4 | 4 |  |
| Thu | 1 | 1 | |
| Fri | 0 | 0 | |
| Sat | 4 | 4 | |
(Go To: Top | General Summary | Monthly Report | Daily Summary | Hourly Summary | Domain Report | Organization Report | Browser Report | Browser Summary | Operating System Report | Status Code Report | File Size Report | File Type Report | Directory Report | Request Report)
Each unit () represents 1 request for a page.
| hour | #reqs | #pages | |
|---|---|---|---|
| 0 | 0 | 0 | |
| 1 | 0 | 0 | |
| 2 | 0 | 0 | |
| 3 | 0 | 0 | |
| 4 | 0 | 0 | |
| 5 | 1 | 1 | |
| 6 | 0 | 0 | |
| 7 | 0 | 0 | |
| 8 | 3 | 3 | |
| 9 | 0 | 0 | |
| 10 | 1 | 1 | |
| 11 | 0 | 0 | |
| 12 | 2 | 2 | |
| 13 | 0 | 0 | |
| 14 | 1 | 1 | |
| 15 | 1 | 1 | |
| 16 | 1 | 1 | |
| 17 | 0 | 0 | |
| 18 | 0 | 0 | |
| 19 | 1 | 1 | |
| 20 | 0 | 0 | |
| 21 | 0 | 0 | |
| 22 | 0 | 0 | |
| 23 | 0 | 0 |
(Go To: Top | General Summary | Monthly Report | Daily Summary | Hourly Summary | Domain Report | Organization Report | Browser Report | Browser Summary | Operating System Report | Status Code Report | File Size Report | File Type Report | Directory Report | Request Report)
Listing domains, sorted by the amount of traffic.
| #reqs | %bytes | domain |
|---|---|---|
| 11 | 100% | [unresolved numerical addresses] |
(Go To: Top | General Summary | Monthly Report | Daily Summary | Hourly Summary | Domain Report | Organization Report | Browser Report | Browser Summary | Operating System Report | Status Code Report | File Size Report | File Type Report | Directory Report | Request Report)
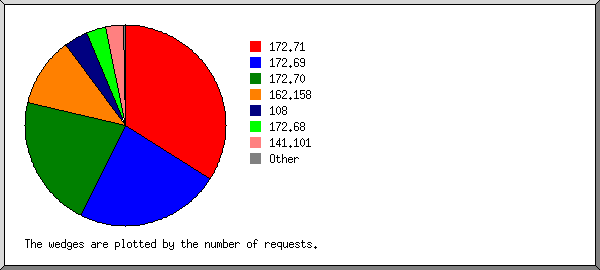
Listing organizations, sorted by the number of requests.
| #reqs | %bytes | organization |
|---|---|---|
| 5 | 45.45% | 172.71 |
| 5 | 45.45% | 172.70 |
| 1 | 9.09% | 108 |
(Go To: Top | General Summary | Monthly Report | Daily Summary | Hourly Summary | Domain Report | Organization Report | Browser Report | Browser Summary | Operating System Report | Status Code Report | File Size Report | File Type Report | Directory Report | Request Report)
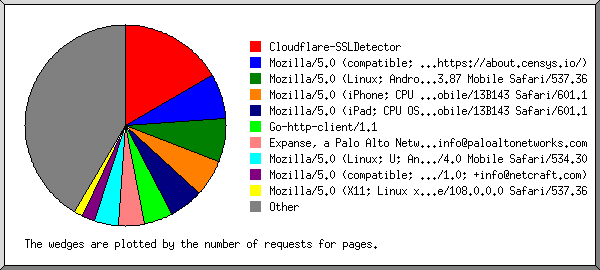
Listing browsers with at least 1 request for a page, sorted by the number of requests for pages.
| #reqs | #pages | browser |
|---|---|---|
| 9 | 9 | Mozilla/5.0 (compatible; CensysInspect/1.1; +https://about.censys.io/) |
| 1 | 1 | Mozilla/5.0 AppleWebKit/537.36 (KHTML, like Gecko; compatible; bingbot/2.0; +http://www.bing.com/bingbot.htm) Chrome/103.0.5060.134 Safari/537.36 |
(Go To: Top | General Summary | Monthly Report | Daily Summary | Hourly Summary | Domain Report | Organization Report | Browser Report | Browser Summary | Operating System Report | Status Code Report | File Size Report | File Type Report | Directory Report | Request Report)
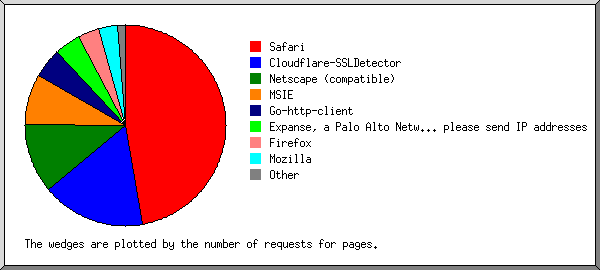
Listing browsers with at least 1 request for a page, sorted by the number of requests for pages.
| # | #reqs | #pages | browser |
|---|---|---|---|
| 1 | 9 | 9 | Netscape (compatible) |
| 2 | 1 | 1 | Safari |
| 1 | 1 | Safari/537 |
(Go To: Top | General Summary | Monthly Report | Daily Summary | Hourly Summary | Domain Report | Organization Report | Browser Report | Browser Summary | Operating System Report | Status Code Report | File Size Report | File Type Report | Directory Report | Request Report)
Listing operating systems, sorted by the number of requests for pages.
| # | #reqs | #pages | OS |
|---|---|---|---|
| 1 | 10 | 10 | OS unknown |
(Go To: Top | General Summary | Monthly Report | Daily Summary | Hourly Summary | Domain Report | Organization Report | Browser Report | Browser Summary | Operating System Report | Status Code Report | File Size Report | File Type Report | Directory Report | Request Report)
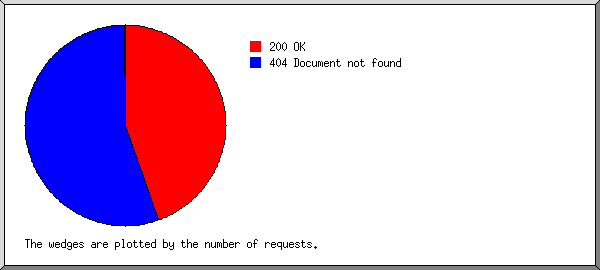
Listing status codes, sorted numerically.
| #reqs | status code |
|---|---|
| 11 | 200 OK |
| 10 | 404 Document not found |
(Go To: Top | General Summary | Monthly Report | Daily Summary | Hourly Summary | Domain Report | Organization Report | Browser Report | Browser Summary | Operating System Report | Status Code Report | File Size Report | File Type Report | Directory Report | Request Report)
| size | #reqs | %bytes |
|---|---|---|
| 0 | 0 | |
| 1B- 10B | 0 | |
| 11B- 100B | 0 | |
| 101B- 1kB | 11 | 100% |
(Go To: Top | General Summary | Monthly Report | Daily Summary | Hourly Summary | Domain Report | Organization Report | Browser Report | Browser Summary | Operating System Report | Status Code Report | File Size Report | File Type Report | Directory Report | Request Report)
Listing extensions with at least 0.1% of the traffic, sorted by the amount of traffic.
| #reqs | %bytes | extension |
|---|---|---|
| 11 | 100% | [directories] |
(Go To: Top | General Summary | Monthly Report | Daily Summary | Hourly Summary | Domain Report | Organization Report | Browser Report | Browser Summary | Operating System Report | Status Code Report | File Size Report | File Type Report | Directory Report | Request Report)
Listing directories with at least 0.01% of the traffic, sorted by the amount of traffic.
| #reqs | %bytes | directory |
|---|---|---|
| 11 | 100% | [root directory] |
(Go To: Top | General Summary | Monthly Report | Daily Summary | Hourly Summary | Domain Report | Organization Report | Browser Report | Browser Summary | Operating System Report | Status Code Report | File Size Report | File Type Report | Directory Report | Request Report)
Listing files with at least 20 requests, sorted by the number of requests.
| #reqs | %bytes | last time | file |
|---|---|---|---|
| 11 | 100% | Mar/29/23 4:52 PM | [not listed: 1 file] |